
Science ISA Part 2: Water Volume Vs. Boiling TIme
* school science1. Overview
1.1. Experiment Description
In this experiment, different volumes of water will be heated on the same stove in the same container under identical condition's to measure how long each sample takes to boil. The water volume is raised in increments(118 mL/1/2 cup) each trial, and the boiling time is recorded.
1.2. Hypothesis
If the volume of water is increased, then the boiling time will increase. This will happen because a larger amount of water requires needs more energy to reach its boiling point.
1.3. Control Variables
- 1: Water Container:
Different kettles have different shapes and materials can change how it speeds it up.
- 2: Surface Heat.
A hotter surface will incresae heat transfer and make it faster. It is important that the heat source remains constant.
- 3: Atmospheric Pressure:
The experiment must be conducted at the same location/altitude to minimize the change of atmospheric pressure. Higher pressure decreases the boiling point
2. Experiment
2.1. Materials List
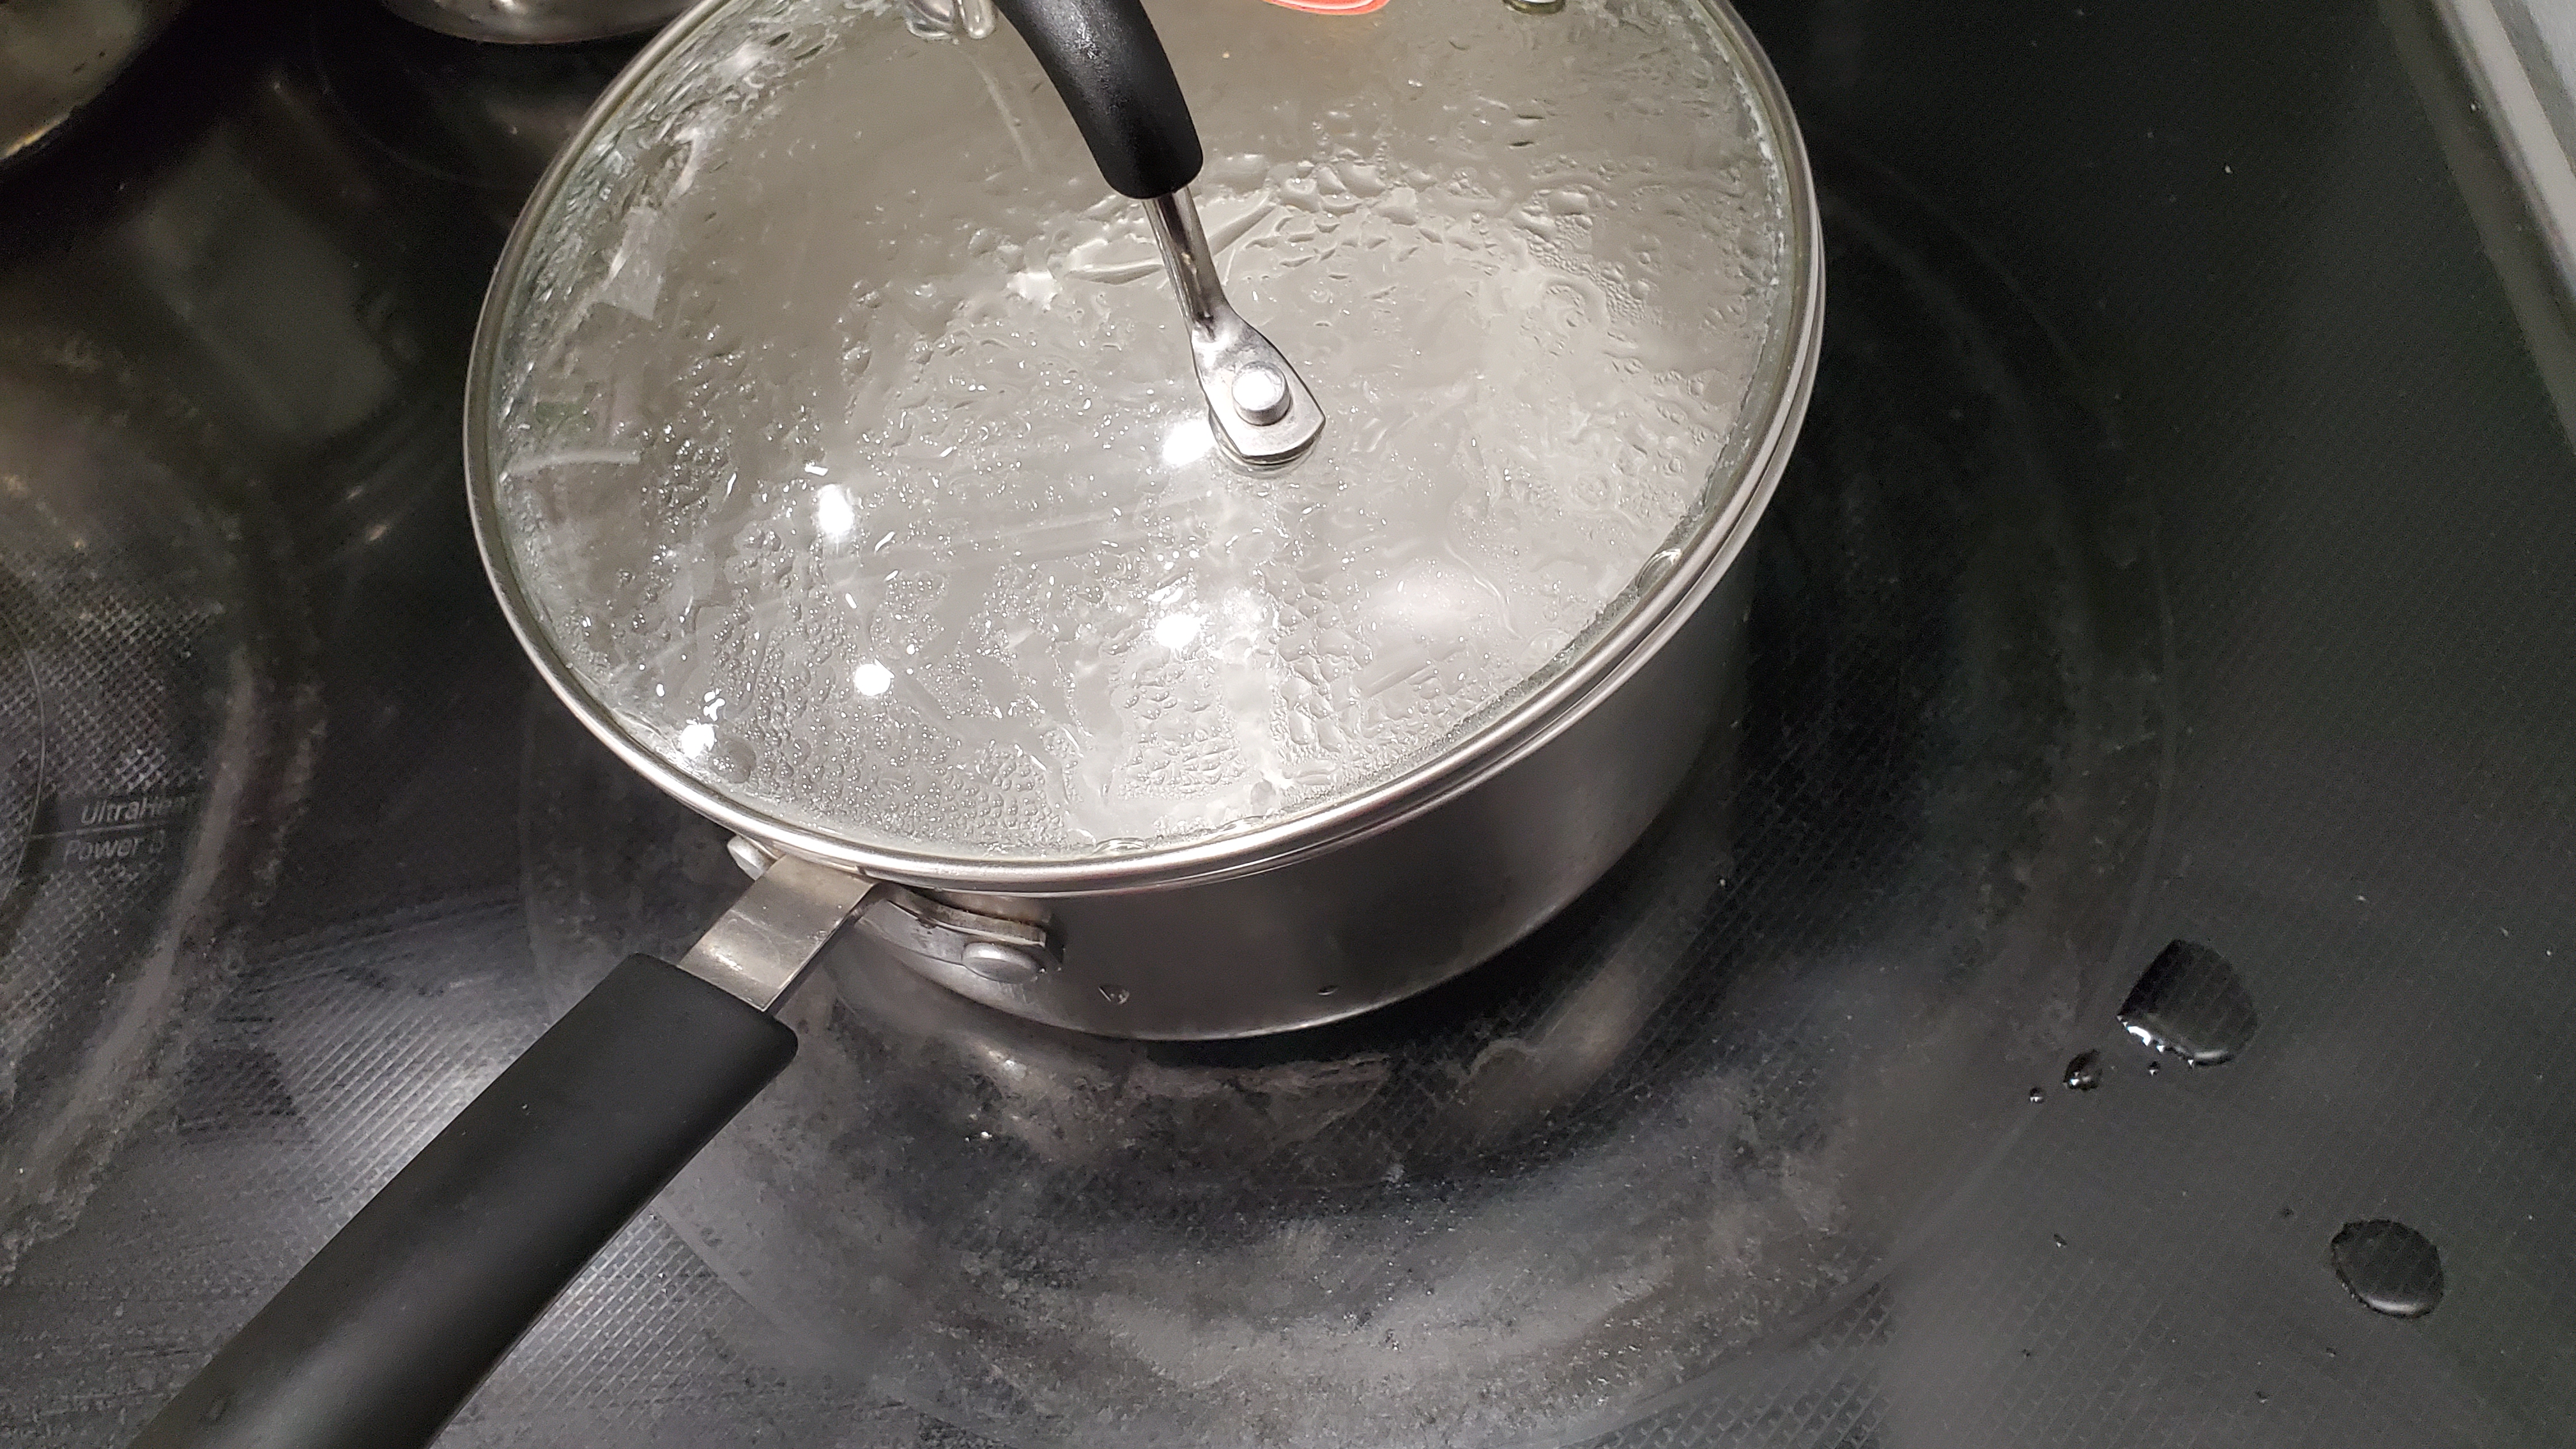
- Metal Pot(19.5cm inner diameter with a height of 8.5cm)
- Pot lid
- Stovetop
- Beaker or Measuring jug(for pouring measured water)
- Stopwatch or timer.
- Oven mitts for safety
- Heat resistant mat for cooling
- Water
2.2. Procedure
- Set heat source. Choose a stove setting and keep it constant for every trial. Remember the position of the knob
- Measure water volume. Using whichever tool you chose to measure the water(beaker, measuring jug, …). Pour water into the pot in increments of 118 mL each trial.
- Place pot on burner and cover with lid. Put the pot on the burner and put the lid on top of it. Start the stove at the predetermined setting.
- Start timing. Start the stopwatch immediately after placing the pot on the burner. .
- Record Boiling point. Record the time when the water reaches a rolling boil and large bubbles are forming.
- Cool Pot Turn off the stovetop. Pour out the water and douse the pot with water. Place pot on your heat-resistant mat and wait for at least 10 minutes
- Repeat Add the next measured volume(add 118mL more each trial so totals are 118, 236, 354, … etc. Repeat steps 2-7 and record all times
2.3. Images
3. Results
3.1. Quantitative Observations
| Trial | Volume(mL) | Boiling Time(seconds) |
| 1 | 118 | 97 |
| 2 | 236 | 164 |
| 3 | 354 | 215 |
| 4 | 472 | 265 |
| 5 | 590 | 315 |
| 6 | 708 | 355 |
| 7 | 826 | 395 |
| 8 | 944 | 430 |
3.2. Graph
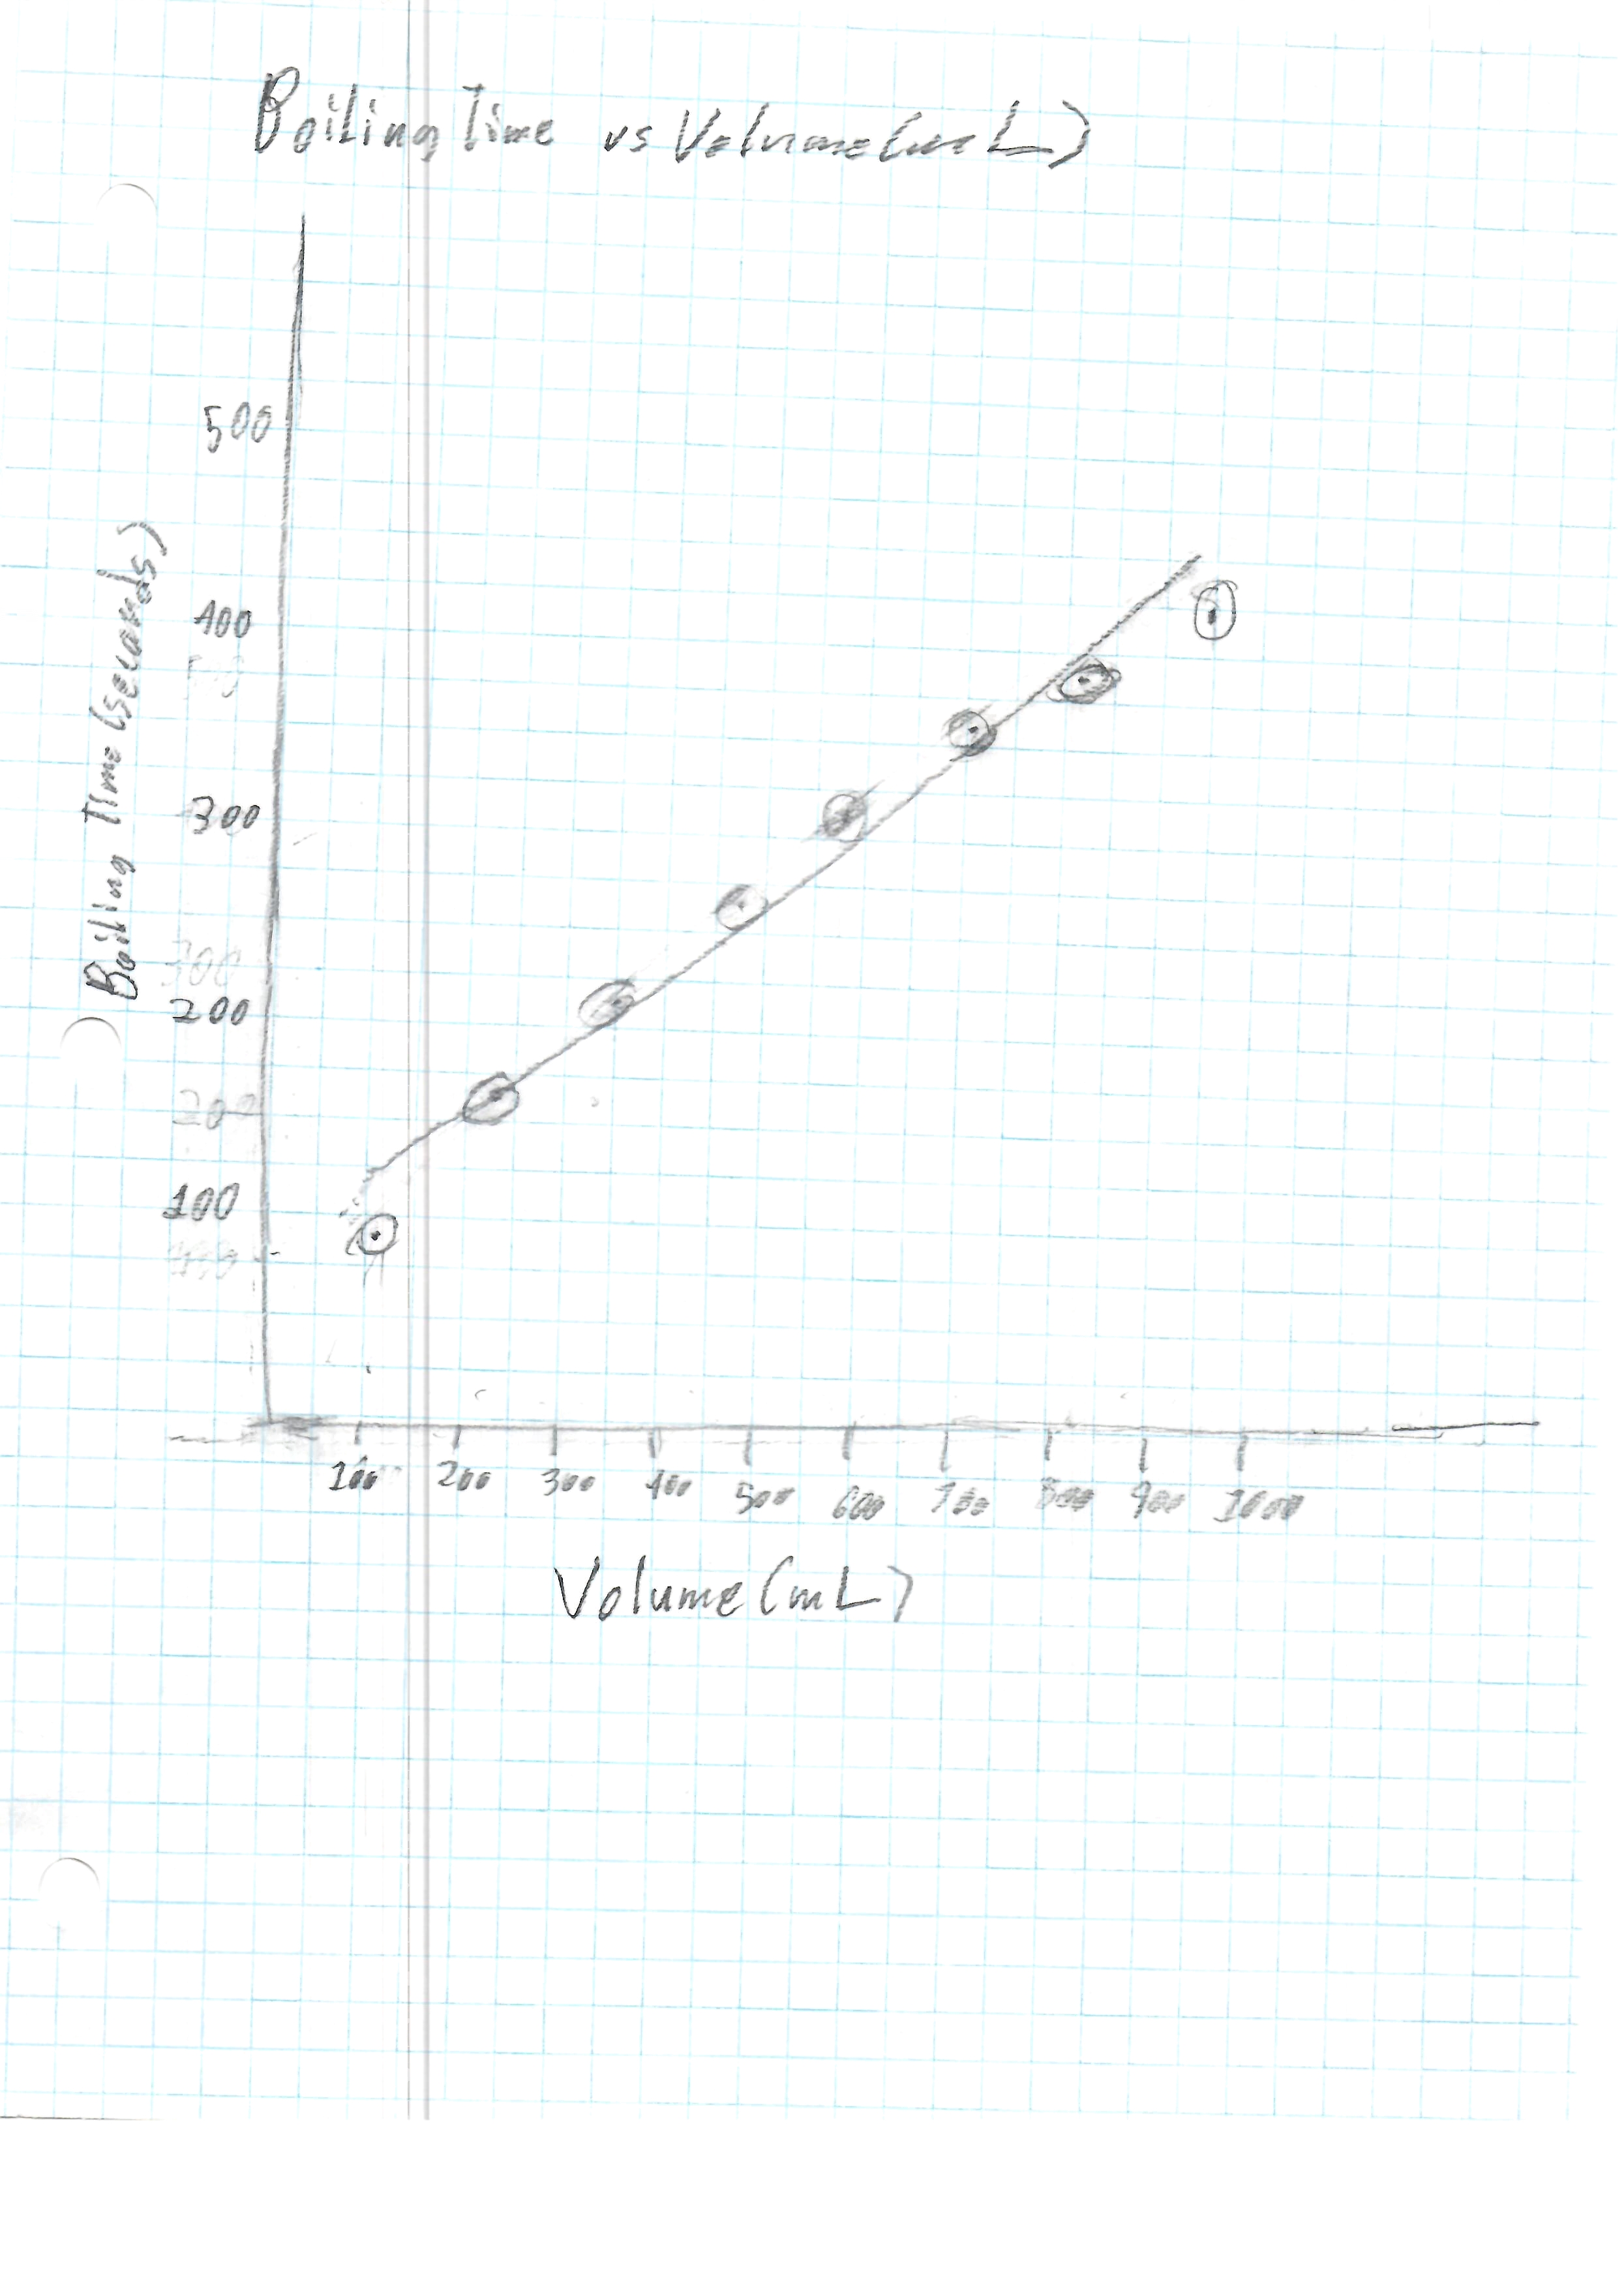
3.3. Conclusions
The hypothesis is supported by the data. The data clearly demonstrates that as the volume of water increases, the time required for it to boil also increases. There is a consistent, positive trend.
4. Elsewhere
4.1. References
4.2. In my garden
Notes that link to this note (AKA backlinks).